9 ESSAYS · BAND 8 · REFERENCE ARCHIVE
TASK 2 · DOUBLE QUESTIONS

Police Enforcement of Laws
Certain laws have little effect now because it is difficult for the police to enforce them. Why is that? How can this problem be solved?
Legislation frequently falls short of its intended outcomes. Nowadays, many laws produce little effect because the police find them difficult to enforce. The causes are varied, and sensible solutions must address several fronts at once.
One primary reason lies in the insufficient police resources in many places. Decreasing numbers of young people, especially in developed countries, choose policing over careers that offer lower risk and better pay. Combined with the retirement of experienced officers, this creates a persistent shortage of personnel. As a result, laws that depend heavily on active police supervision suffer from inadequate manpower. A law regulating cybersecurity, for instance, cannot realistically be enforced when only a handful of specialists must cover the internet activity in an entire province or state. Beyond staffing shortages, the current issue also stems from problematic legislation. Some laws are drafted with vague wording and excessive scope for interpretation that leave officers without clear, objective standards to apply. Many regulations contain catch-all phrases such as “other behavior that might be deemed inappropriate or offensive.” Offenders can then argue, often successfully, that their actions fall outside the defined category. This not only hampers police action but also wastes time on disputes that are almost impossible to resolve.
Therefore, the remedies, while addressing multifaceted problems, lie mainly with lawmakers. First, to tackle the shortage of manpower, attracting new, young entrants is the key solution. Governments would need to examine what deters young people from joining the police, from which they would likely find a combination of safety concerns and insufficient pay. In this light, if targeted legislation to improve conditions and career prospects were implemented, aspiring young people would face fewer worries when deciding to serve the community. Nevertheless, these measures would need to be carefully monitored to prevent a cycle of disillusionment. Also, existing laws should be revised for greater clarity. If lawmakers replaced ambiguous terms with precise, measurable criteria, officers would have straightforward standards to enforce, which would significantly reduce day-to-day obstacles, thereby greatly facilitating law enforcement.
In summary, the limited effectiveness of certain laws arises chiefly from police understaffing and from poorly drafted legislation. Meaningful improvement requires action on both fronts but largely rests with legislators.
TASK 2 · OPINION

University Education — Who Should Pay?
Some people believe that university students should pay all the cost of studies because university education only benefits students themselves, not the society as a whole. To what extent do you agree or disagree?
University education has been recognized as vital for individuals, and many governments have moved to subsidize tertiary education so that more people can benefit. Nevertheless, a prevailing view nowadays holds that university students should pay for the entirety of university studies as they are the sole beneficiary and the society does not have a share. While there is some truth in the argument, I tend to disagree with it.
Despite the potential pressure of the public budget, higher education delivers substantial societal returns that justify the funding. Universities produce a skilled workforce, particularly in STEM fields, where graduates drive productivity and innovation through specialized knowledge and advanced technology. The institutions themselves also generate high-level employment for academics and support staff, sustaining a valuable talent pool.
More importantly, tertiary study cultivates critical and creative thinking across disciplines. Graduates internalize rational, evidence-based approaches to problems, fostering a broader social climate of stability and reasoned discourse rather than polarization or unrest. If students were forced to shoulder the entire cost, many from less affluent backgrounds would be compelled to drop out, diminishing these collective gains and ultimately shifting the burden back onto society.
Proponents of the view rightly note the strain on public finances and the often intangible nature of research outputs in fields such as materials science, which may seem remote to ordinary taxpayers. Yet it is fallacious to insist that funding should reflect only direct, immediate beneficiaries. By that logic, roads and railways should be financed solely by motorists and rail users. This narrow view ignores the long-term societal benefits that arise when graduates contribute, sometimes indirectly, their knowledge and skills for the common good.
In conclusion, in my view, students should not be the sole payer of the cost of university studies. Granted, some benefits of higher education for the society may not be as transparent as many expect, public subsidizing helps ensure the accessibility of university education and thus enhances the society’s productivity and moral development.
TASK 2 · DISCUSSION

Rewarding Students — Excellence vs. Improvement
Some people think that only the best students should be rewarded. Others, however, think that it is more important to reward students who show improvements. Discuss both these views and give your own opinion.
Rewards have been widely recognized as an effective way to motivate students. That said, opinions about the type of students to be rewarded vary widely. At one end is the view that only the best students should receive recognition, while at the other end, some argue that it is more important to reward students who show significant improvement. While both opinions have validity, my personal conviction leans towards the latter view.
Rewarding improvement is constructive as it cultivates a growth mindset by signaling to every student, regardless of starting point, that effort and progress bear genuine significance. Recognition thus becomes accessible rather than the preserve of an already advantaged minority, which helps narrow achievement gaps instead of widening them. Moreover, this focus on incremental gains better equips most learners for adult life, where the great majority occupy average positions and sustained personal development matters far more than an early start. At the same time, even able students benefit, as the prospect of further prizes keeps them striving rather than allowing complacency to set in once they have reached the top. Education, after all, loses much of its purpose if mediocrity is penalized.
By contrast, rewarding only the best students adopts a strictly results-oriented stance. This method largely simulates how society works and prepares students for what they are going to encounter in the real world. If students received rewards according to their absolute performance level, they would be accustomed to a system where appraisals are based purely on contribution and outcome. This would not only stimulate diligence but also alleviate future frustration when they were ever paid less due to underperformance.
In my opinion, rewarding only high-achieving students can be counterproductive in a classroom setting, as it often leads to a winner-takes-all environment that can demoralize the average student while nurturing complacency in those initially at the top. By contrast, a system that rewards improvement acts as a more holistic assessment tool. It ensures that the educational process remains inclusive and motivates weaker students to strive for better results and preventing gifted students from stagnating.
In conclusion, while rewarding top performers prepares students for the competitive realities of the workplace, rewarding improvement provides a more equitable and motivating framework for the entire student body. I believe that a focus on progress ensures that education remains a tool for personal transformation rather than a mere confirmation of existing advantages.
TASK 2 · DOUBLE QUESTIONS

Consumer Goods — Environmental Damage
The increase in the production of consumer goods results in damage to the natural environment. What are the causes of this? What can be done to solve this problem?
Industrial development is widely perceived as detrimental to the environment. While this is partly a stereotype, a prevalent problem is that the growing manufacture of consumer goods leads to environmental damage. The reasons stem from both the producer side and the consumer end, and measures, therefore, need to address the two fronts at once.
One of the main features of consumer goods is that their production scale is largely determined by consumer demands, which have boomed in recent years. Thus, the quantity of items produced has grown. The issue lies in that factories producing those products are often established in developing regions where labor costs are significantly lower, technology is less advanced, and environmental regulations are relatively loose. As a result, pollutants such as contaminated water run-off and toxic gases have considerably increased, as seen in the production of plastic toys and chemical detergents in Southeast Asia. Pollution also occurs after consumers purchase the goods. The current society is often called a “throw-away society,” where products are used for a very brief period and then discarded, due to higher purchasing power, a larger variety of product options, and faster upgradation of products like electronics. This creates problems with subsequent disposal, as batteries, plastics, and other materials that are hard to break down often fail to be processed appropriately, and the waste frequently ends up buried in landfills, which exacerbates soil erosion and underground water contamination.
In this light, the solutions appear clear. Both ends of the commercial process need to be regulated. On the producer side, laws should be made and effectively enforced to restrict manufacturer behavior through both regulation and punishment. For instance, irresponsible firms that fail to meet emission standards should be fined or even suspended from production, regardless of where their manufacturing sites are located. Planned obsolescence should also follow certain restrictions, including not only a maximum number of years of use but a minimum one, to reduce the rate at which pollutants are generated. To address the disposal issue, if stricter regulations were published, the bottom line regarding the disposal of discarded items could be stipulated, and guidance could be provided on reducing waste through recycling and reuse.
In summary, the growing pollution caused by production arises chiefly from the lack of regulation both for the sellers and buyers. Meaningful improvement requires action on both fronts but largely rests with lawmakers.
TASK 2 · OPINION

Remote Work — Benefiting Whom?
Many employees can now do their work from home using modern technology. However, this change may only benefit workers, not the employers. To what extent do you agree or disagree?
The COVID-19 epidemic accelerated the demand for telecommuting, and with ongoing technological advancements in this field, working from home remains prevalent even in the post-COVID era. However, an opinion holds that this trend benefits employees exclusively, leaving employers at a disadvantage. While this concern is understandable, my personal conviction differs.
While technologies including online meeting platforms and collaborative documents clearly save commuting time and can accelerate work progress as they enable employees to complete projects without being physically present, some employers interpret the outcome differently. Rather than recognizing this as improved efficiency, they focus on the seemingly shorter working hours, presuming that employees are reaping benefits without the company gaining proportionally. That said, this view is based on sentiment rather than fact. Salaries are paid for outcomes, not for commuting time, which is not accounted for in the job description. It is thus unjustified to judge who benefits solely by comparing the time spent on chores. Some also highlight the lack of supervision and assume that efficiency is lower. However, modern collaborative applications now allow effective monitoring through features such as log recording and tracked changes, and the assumption that physical oversight necessarily improves productivity overestimates the correlation between supervision and output.
On the other hand, while this trend clearly benefits employees, it also offers significant advantages to employers, many of which are interdependent. One of the most widely mentioned ones is the enhanced working efficiency, from which the company ultimately benefits. Many collaborative applications allow not only simultaneous work but also tracked revision logs, enabling employers to monitor progress and contact individual contributors if further adjustments are required. Moreover, although some employers may be wary of employees appearing too relaxed, the improved work experience associated with telecommuting actually fosters loyalty by increasing job satisfaction, thereby reducing turnover. This, in turn, enhances the company’s reputation and raises the likelihood of attracting more competent talent, which ultimately creates a positive feedback loop.
Overall, while working from home undeniably brings advantages to employees, the benefits for employers are equally evident. It is therefore both simplistic and unfair to claim that employees are the sole beneficiaries.
TASK 2 · DOUBLE QUESTIONS

Fathers as Caregivers — A Gender Role Shift
These days, more fathers stay at home and take care of their children, while mothers go out to work. What could be the reasons for this? Do you think it is a positive or negative development?
Traditionally, in many places of the world, men are believed to be the breadwinner of a family while women shoulder the responsibility of childcare. Yet discernible changes have been observed, with a growing tendency for males to stay at home and for females to provide for the family. Multiple factors have contributed to this development, which, in my estimation, is generally positive.
Reasons behind this trend are multifaceted, with the shift in public perception being a principal one. In the past, as a result of patriarchy, which had existed for centuries, women were considered inferior to men and meant to undertake responsibilities that are seemingly less significant, such as chores and childcare. Campaigns and battles for equal rights and opportunities of women, particularly since the 20th century, have changed this perception and made people realize women’s inalienable rights to pursue personal career, power, or simply getting paid for their dedication. Another factor happens to be also related to the perception shift, which is the advancements of productivity. Recent technological progress, along with the industrial transformation in many places around the world, has enabled the majority of work to be done without intense physical labor thanks to the existence of machinery and computers. That largely bridges the gap between males’ and females’ competence in the workplace, and thus gradually reducing women’s disadvantages in job seeking and making it possible for the trend in question to occur.
While such a significant societal transformation inevitably raises criticism, I deem it a generally positive development. As widely recognized, it signals the increasing tolerance of society and the prevalence of universal values. The increase of females in the workplace marks a milestone of promoting equality for all, which very likely would encourage the improvement of equal rights and opportunities in other fields such as ensuring the rights of individuals in poverty or with disabilities. Also, this transition not only benefits women but also grants men the right to choose. The stereotypical social norm often lays great burdens on men, who are considered to be born to choose career over family. With this turn, they are allowed to choose how their lives are fulfilled without fearing to be blamed for not showing masculinity or not doing what are supposed to be men’s jobs.
Overall, the shift between the two gender roles arises from the developments of both social perception and technology. It introduces significant advantages, as it ensures the rights of both genders and can potentially drive further social progress.
TASK 2 · DISCUSSION

Government Funding for Arts Education
Some people think that the government should fund music, dance, and art lessons for children. Others think that they should be funded by private businesses or by children’s families. Discuss both views and give your own opinion.
While modern education emphasizes holistic development, the responsibility for funding arts programs—such as music and dance—remains a point of contention. Some argue for government subsidies, while others believe the financial burden should lie with private enterprises or families. In my view, the ideal funding model depends entirely on a nation’s specific stage of development.
Proponents of state funding highlight the prohibitive costs of high-quality art education. As the arts often require customized, one-on-one instruction to master, they are frequently inaccessible to the average family. Government subsidies would democratize these subjects, often by integrating them into the core curriculum of primary and secondary schools. This ensures that a child’s creative potential is not stifled by their socioeconomic background. Furthermore, ensuring wider accessibility to art courses benefits the government itself as well. A culturally literate and creative population fosters innovation across all sectors, ultimately enhancing a country’s soft power and long-term competitiveness.
On the other hand, opposing views hold that the arts, having no direct impact on productivity, should be an optional path that only people who can afford it choose. They suggest that government funding should be allocated to areas more critical to technological advancements and economic growth, such as computer science and traditional STEM subjects. If families decide to let their children pursue an art trajectory which does not seem to directly contribute to the society, they should handle the financial issues on their own instead of relying on social welfare. Also, for companies that aim to encourage more entrants, such as firms in the entertainment industry, it is also their duty to pay for a scheme that benefits them the most. This is exemplified by many trainee programs offered by MCN agencies.
From my perspective, there is no single one-size-fits-all answer to this question, and it depends on each country’s present focus of development. In developed countries like the US, the UK, and many West European countries, the technological development has been advanced and their talent pool is virtually oversaturated. In this case, it is indeed necessary for the government to consider what to do to facilitate people’s further pursuit, for example, of art and personal fulfilment it brings, where government funding appears reasonable. Nevertheless, in developing places, such as India and China, productivity advancement still carries more weight than aesthetic development of the citizens. Therefore, from a functionalist perspective, whether children can afford art education rests with their families or the beneficiary companies.
In summary, as to which party should shoulder the financial burden of art education, the answer is country-specific. A government-funded pattern may yield satisfying results in developed areas, whereas in other regions, this path should still be a personal choice and thus should be paid for by individuals or private enterprises.
TASK 2 · OPINION

Clean Water — Should It Be Free?
Access to clean water is a basic human right. Therefore, every home should have a water supply that is provided free of charge. Do you agree or disagree?
Access to clean water has been widely recognised as a fundamental human right, which, however, requires more efforts to defend. In this context, a prevailing opinion holds that clean water should be supplied to every household for free. Whilst there is some truth in the argument, I tend to disagree with it.
Valid as it may seem, such a scheme risks poor feasibility in the short term and low sustainability in the long haul. One major concern is that free water supply very likely results in the waste of water. Using a resource without paying for it tends to introduce relentless consumption, as the consequent cost is no longer visualised. If people were not responsible for the burden, there would be no reliable constraint to restrict overconsuming, since the consequence is neither felt. That cost, however, would not vanish, but would be transferred to the public budget.
Ensuring free provision of clean water, where personnel and infrastructure for producing such resources come with high expenditure, requires substantial financial support from the government. When the public budget is finally stretched, the government has to either raise taxes in other areas or cut funds that would otherwise be allocated to other fields, including critical ones such as healthcare and education. This result, together with the potential resource depletion caused by overconsumption of water, appears counterproductive in protecting basic human rights.
Proponents of this idea often highlight inequality in water access caused by water fees, arguing that it infringes upon human rights when some people cannot afford clean water. However, universal free provision may be an overly simplistic solution, as its benefits for certain groups come at the expense of the long-term well-being of society as a whole. Rather than a system that is entirely for free, more holistic approaches can help strike a sustainable balance. For instance, a tiered supply system that guarantees a basic amount of water free of charge while imposing fees on use beyond that level can ease the financial burden that is often overwhelming for impoverished families, without undermining public finances or encouraging overconsumption.
In conclusion, there is little justification for providing clean water entirely free of charge to every household. Granted, unequal access to water does raise legitimate concerns about fairness and human rights, but removing all user costs is neither a sustainable nor an effective response. A system that guarantees a basic level of water use while charging for excessive consumption better protects that right without encouraging waste or placing undue strain on public finances.
TASK 2 · OPINION

Free Public Transport — Solving Congestion?
Some people say the best way for the government to solve traffic congestion is to provide free public transport 24 hours a day and 7 days a week. To what extent do you agree or disagree?
It has sometimes been argued that the best solution to traffic congestion is the provision of public transport free of charge, 24 hours a day and 7 days a week. While there is some truth in the assertion that such a scheme could positively contribute to ameliorating the current situation, it is not likely the best way.
One key limitation of around-the-clock free public transport lies in the low feasibility. Building a public service system of this scale requires substantial investment in infrastructure and human resources. Apart from the construction of additional routes, the operational cost is also a money pit. As no charge is imposed on the users, all financial burdens will have to be shouldered by the government, which inevitably will affect the allocation of funding to other fields. Considering the urgency in comparison with other issues, such as unemployment, economic instability, and rising healthcare costs, it is unjustifiable to ease traffic pressure in a way that is at the expense of improvements in other critical fields.
In contrast, the key to smooth traffic is to ensure a consistent, controlled traffic flow. To achieve that, a system that allows multiple channels to operate simultaneously, such as tidal flow systems and traffic diversion, would be much more effective. For one thing, it does not depend on the shift of the public commuting behavior, without which universal free public transport could not be effective, and thus avoids subsequent resistance to the reform. For another, it not only prevents the public budget from being stretched but also generates tax revenue through road pricing. In this light, allocating funds to multi-lane construction while maintaining the current public transport would be a superior choice.
Proponents of universal free public transport often picture a situation where commuters would prioritize using public facilities over driving private cars. Admittedly, should that be the case, the pressure on city roads would be significantly reduced. However, people who are not sensitive to price would still likely drive to their destinations for convenience. Also, congestion would not vanish but would only appear as packed buses and trains, which makes no difference regarding people’s experience and the overall transportation efficiency.
In conclusion, a free public transport available all the time faces issues of poor feasibility and low effectiveness, and there are more sensible measures. Granted, it would work well if the optimal hypothesis came true, but realistic factors lower the likelihood.
TASK 1 · LINE GRAPH
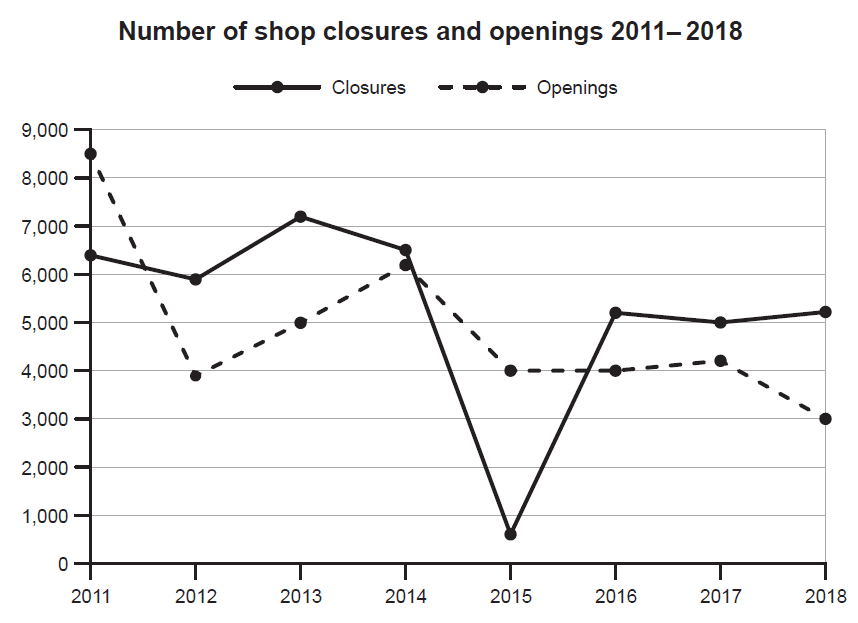
Shop Closures and Openings
The graph below shows the number of shops that closed and the number of new shops that opened in one country between 2011 and 2018.
Summarise the information by selecting and reporting the main features, and make comparisons where relevant.
The line graph illustrates changes in the number of shop closures and openings in a particular country over the period from 2011 to 2018.
Overall, both shop openings and closures showed downward trends over the period, although the number of closures generally exceeded the number of openings. The figure for closures also experienced much greater fluctuations than that for openings.
In detail, 8,500 shops were newly opened in 2011. The figure then more than halved over the subsequent year, before rebounding back to over 6,000 in 2014. The latter half of the span witnessed a steadier decline in shop openings. After dropping to 4,000 and staying at approximately that level for several years, the number fell to 3,000 at the end of the period.
In comparison, the figure for shop closures showed greater fluctuations. While the number swung between 6,000 and 7,100 in the early stage, it plummeted to a low of below 1,000 in 2015, creating the largest gap between openings and closures. However, shop closures surged back and overtook shop openings in the following year and then leveled off at around 5,000 for the rest of the period.
TASK 1 · BAR CHART
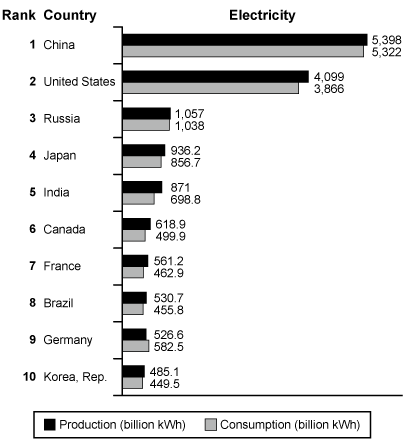
Electricity Production and Consumption
The bar chart below shows the top ten countries for the production and consumption of electricity in 2014.
Summarize the information by selecting and reporting the main features, and make comparisons where relevant.
The bar chart presents the ten countries that produced and consumed the most electricity in 2014.
Overall, China stood out as both the largest producer and consumer of electricity. Except for Germany, all the countries produced more electricity than their demands, though the differences were generally minor.
Specifically, with regard to production, China generated the most electricity, reaching 5,398 billion kWh, followed by the United States at 4,099 billion kWh, which was roughly three times the production of Russia (1,057 billion kWh). By contrast, the Republic of Korea recorded the smallest output, at just 485.1 billion kWh. For the remaining countries in question (Japan, India, Canada, France, Brazil, and Germany), the productions ranged between 500 and 950 billion kWh, with Brazil and Germany registering similar figures, both at around 530 billion kWh.
In terms of consumption, most countries used less electricity than they produced, apart from Germany, whose usage reached 582.5 billion kWh. China's electricity demand was by far the greatest, at 5,322 billion kWh, while the Republic of Korea consumed the least electricity, using slightly under 450 billion kWh. Notably, Russia's production-consumption gap was the least significant among the ten.
TASK 1 · PIE CHART

Pie Chart — Placeholder
[Task 1 Pie Chart prompt to be added]
[Task 1 Pie Chart report to be added. Replace this placeholder text and image with the actual prompt, chart image, and Band 8 model report.]
TASK 1 · TABLE
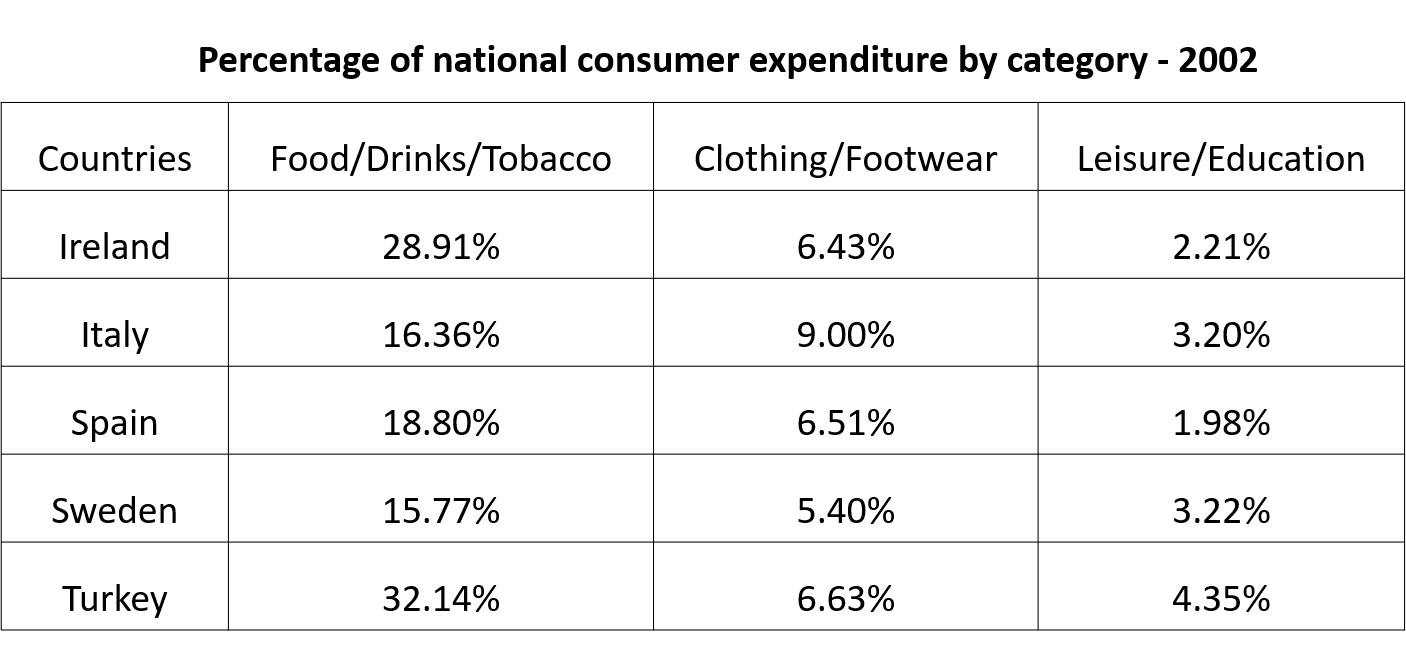
Consumer Spending in Five Countries
The table below gives information on consumer spending on different items in five different countries in 2002.
Summarize the information by selecting and reporting the main features, and make comparisons where relevant.
The table gives a breakdown of how much consumers in Ireland, Italy, Spain, Sweden, and Turkey spent on different items in 2002.
Overall, it is clear that food, drinks, and tobacco was by far the predominant category among the three in all the countries. In addition, Turkey recorded the highest total proportion of consumer expenditure on the three items.
Specifically, 32.14% of Turkey's national consumer spending was on food, drinks and tobacco, registering the highest figure of all and closely followed by the figure for Ireland, at 28.91%. Consumers in both countries dedicated roughly 6.5% of their spending to clothing and footwear. Turkey also topped the list of leisure and education expenses, at about 4.5%, about twice that of Ireland.
In the remaining countries, significantly lower proportions of consumption were put on dietary and tobacco goods, ranging from 15% to 20%. On the other hand, Italy accounted for the highest spending on clothing and footwear, at 9.00%, while the figures for Spain and Sweden fell within the range from 5% to 6%. Leisure and education represented between 1.98% and around 3.5% in these countries, with Spain allocating the smallest proportion.
TASK 1 · MIXED CHARTS
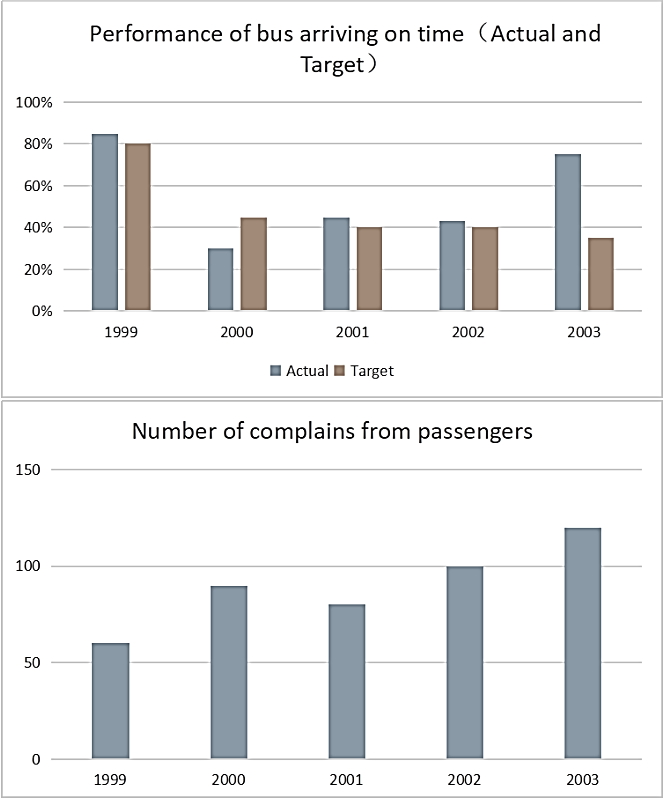
Bus Punctuality and Complaints
The charts below show the performance of a bus company in terms of punctuality, both actual and target (what actually happened compared to what the company was trying to achieve), and the number of complaints and passengers.
Summarize the information by selecting and reporting the main features and make comparisons where relevant.
The first bar chart illustrates the actual and target percentages of buses arriving on time in the US from 1999 to 2003. The second bar chart presents the number of complaints from passengers.
Overall, except in 2000, the actual rate of on-time arrival remained higher than the set target. However, both percentages declined over the period. In the meantime, the number of complaints rose significantly over the span.
In 1999, 80% of the buses were expected to arrive on time, while slightly more buses did so. The target punctuality rate then plummeted and hovered around 40% for the rest of the period. While the actual performance remained similar to the expected result in most years, the figures diverged in 2003, where the actual proportion of buses arriving as scheduled (almost 80%) was twice as high as the target level. Notably, only in 2000 did the actual performance fail to meet the target.
On the other hand, the number of passenger complaints doubled over the period. At the beginning, when both the target and actual performances of bus arrival were high, the fewest passengers reported complaints, with a number of only 60. Despite minor fluctuations, the number grew over the 4 years, reaching its highest point of over 120 in 2003 even after the punctuality had recovered.
TASK 1 · DIAGRAM
Beechwood Farm Changes
The plans below show the site of a farm in 1950 and the same site today.
Summarize the information by selecting and reporting the main features, and make comparisons where relevant.
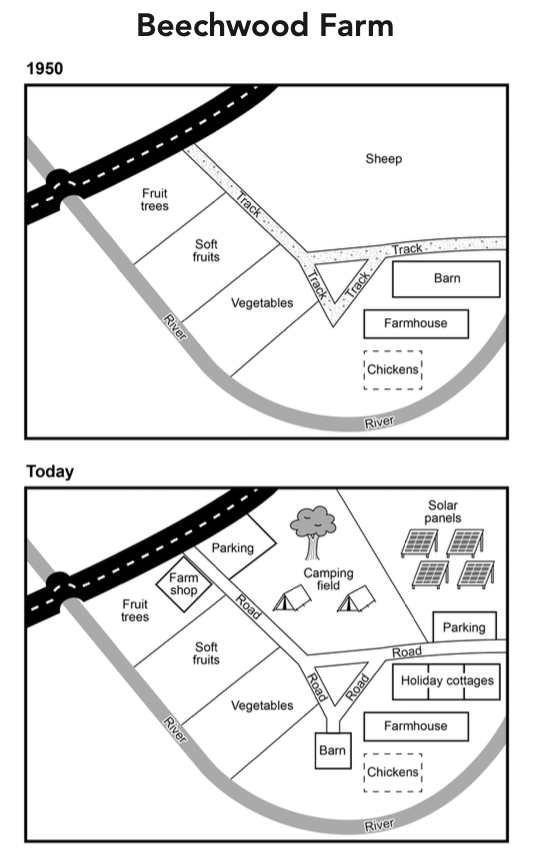
The two maps illustrate how Beechwood Farm has changed from 1950 to the present day.
Overall, the farm has undergone significant changes, with new facilities added to the former livestock area, buildings in the residential zone converted, and the road system upgraded, while the agricultural land and the overall layout remain largely unchanged.
At the southern edge of the farm, a river ran across the area and was crossed by a bridge connecting to the central tracks, which have now been upgraded into proper roads. The tracks divided the farm into three sections, forming a triangular loop in the centre. To the west, three plots of land were used for fruit trees, soft fruits, and vegetables, respectively, and a farm shop has now been built on the fruit tree plot. On the other side of the farm, a barn was located to the south of the eastern track, and it has now been relocated to the lower junction of the roads. Its original site has been converted into holiday cottages. The farmhouse and chicken coop further south have not changed.
Further to the northeast, the area previously used for sheep grazing has been divided into two parts, with one transformed into a camping field and the other used for solar panels. Parking areas have also been constructed in both parts.
TASK 2 · ADVANTAGES AND DISADVANTAGES
Advantages and Disadvantages — Placeholder
[Task 2 Advantages and Disadvantages prompt to be added]
[Task 2 Advantages and Disadvantages essay to be added. Replace this placeholder text with the actual prompt and Band 8 model essay.]
TASK 2 · DISCUSSION

Competition vs Cooperation
Some people think that competition at work, at school and in daily life is a good thing. Others believe that we should try to cooperate more, rather than competing against each other.
Discuss both these views and give your own opinion.
Almost everyone will have to decide whether to compete or cooperate at some point in life. While some people believe that competition is beneficial in both professional and personal life, others take the opposite view, arguing that cooperation is the superior option. While recognising the value of both approaches, I would argue for a combination of the two.
On the one hand, competition can be helpful and even necessary in certain circumstances. First, it often motivates people to outperform others for access to better resources, particularly where evaluation criteria are transparent and objective. For instance, employees may need to outperform their colleagues to secure promotion, since many appraisals are performance-based and results-oriented, while students may have to score higher than their peers to gain admission to top universities, where better educational resources are available. Without some such mechanism, resources would either remain concentrated within already privileged groups or have to be distributed more evenly, neither of which necessarily facilitates the sustainable development of society. In addition, competition can encourage people to pursue higher goals. Much of human desire stems from comparing ourselves with others, and this impulse is an important driver of economic activity. If people did not even envy the greener grass, there would be little economic activity beyond what was necessary for subsistence.
On the other hand, although cooperation is not always a survival necessity, it can be the more efficient choice in many cases. One main reason is that people can combine their skills and resources when working together, often achieving better results than they could individually. Corporate operations, for example, require smooth coordination between different departments and branches, making cooperation indispensable despite occasional competition. Group work at school can likewise encourage the exchange of knowledge, ultimately improving the academic performance of the majority of students. More importantly, a cooperative mindset helps people maintain harmony in their personal lives. No individual could realistically expect to go through life without needing assistance from others. When people both give and receive help, cooperation becomes an indispensable force in sustaining and advancing a community.
In my view, both approaches are valid, but neither works on its own. While competition fuels motivation, cooperation helps to translate it into meaningful gains. Without competition, goals may become obscure and progress may lose its driving force, while without cooperation, competition may degenerate into unproductive infighting. Ultimately, societies benefit most when the two forces complement rather than undermine each other.
TASK 1 · DIAGRAM

Bamboo Fabric Manufacturing
The diagram below shows how fabric is manufactured from bamboo.
Summarise the information by selecting and reporting the main features, and make comparisons where relevant.
The flow chart demonstrates the process of producing fabric from bamboo.
Overall, the production of bamboo fabric is an industrial process that involves eight main stages, starting with the cultivation of bamboo and concluding with the weaving of yarn into fabric, which is subsequently used to manufacture a variety of products.
At the initial stage, bamboo plants are grown in spring, and once they reach maturity in autumn, they are harvested. The raw materials are then cut into strips, which are subsequently crushed to produce a liquid pulp. The next step is to filter the liquid, thereby separating long fibers necessary for fabric production. Water and amine oxide are then added in order to soften the fibers.
After that, the softened fibers are converted into threads that are to be spun into yarn. In the final stage, to transform the current product into fabric usable for industrial applications, the yarn is woven, thus completing the production. The finished fabric is subsequently used to manufacture a wide range of products, including clothing items such as t-shirts and socks.
TASK 1 · MIXED CHARTS
Little Chalfont Library
The charts below give information about a public library in a town called Little Chalfont.
Summarise the information by selecting and reporting the main features, and make comparisons where relevant.
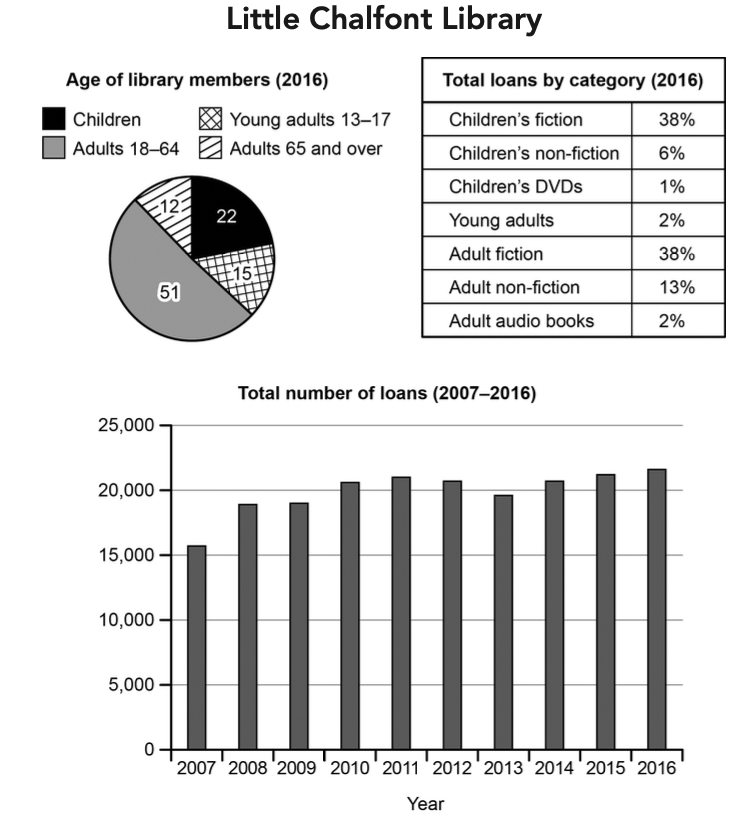
The pie chart illustrates the age distribution of members at Little Chalfont Library in 2016. The table presents the proportion of loans by category in that year, while the bar chart shows the total number of loans over the previous decade.
Overall, adults were the main group among all the members. In addition, fiction works were the most popular type among readers/users, and the total number of loans exhibited a moderate increase over the period.
Specifically, 51% of the readers were adults aged 18 to 64, representing the largest age category, followed by children (22%). Young adults and senior citizens over 65 years old accounted for similar percentages, both at around 15%, with the figure for the former being slightly smaller.
Regarding item categories in 2016, children's fiction and adult fiction recorded identical figures, both at 38%. By contrast, electronic resources (children's DVDs and adult audiobooks) and titles/works/materials for young adults were the least borrowed, with percentages clustering between 1% and 2%. Around 15% of all loans fell within the category of adult non-fiction, approximately twice the figure for children's non-fiction. As for the total number of loans over the ten-year period, borrowing started at just over 15,000 in 2007. The figure climbed steadily, surpassing 20,000 by 2010. Despite a brief decline in 2013 to just below 20,000, the total number of loans recovered thereafter/after that and finally ended at over 21,000 by 2016.
TASK 1 · BAR CHART
Physical Activity in Australia
The bar chart below shows the percentage of Australian men and women in different age groups who did regular physical activity in 2010.
Summarise the information by selecting and reporting the main features, and make comparisons where relevant.
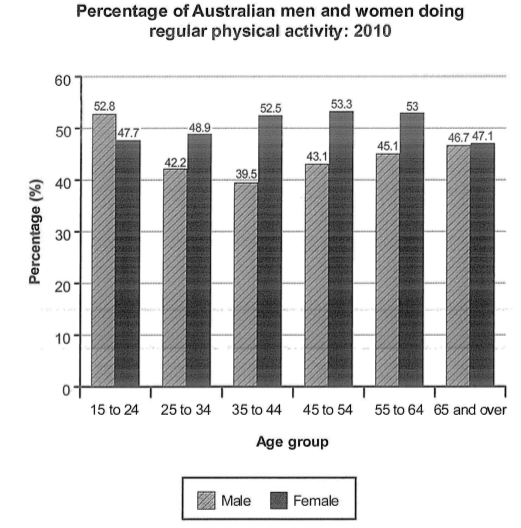
The bar chart illustrates how the percentages of Australian male and female regular exercisers varied across six age groups in the year 2010.
Overall, females were more likely to exercise regularly than males in the country, except those aged 15 to 24. Moreover, females' participation tended to be higher in the middle age groups, while that of males recorded higher figures in the younger and older groups.
Specifically, 53.3% of females aged 45 to 54 years old regularly engaged in physical activity, the highest percentage in the chart. Women in the adjacent age groups recorded similar but slightly lower figures, both at around 53%. The figures for women in the remaining age groups were lower, ranging from 47% to 49%.
On the other hand, the figures for males exhibited greater variation. Only in the 15-to-24 group did male regular exercisers account for a higher proportion (52.8%) than female ones. Men in this group also had the highest percentage across all six categories, in contrast to the lowest percentages in the 35-to-44 group (39.5%), where the greatest gap between male and female participation could be found. The proportions in the remaining groups ranged from 42% to 46%.
TASK 1 · DIAGRAM
Ethanol Production
The diagram below shows how a biofuel called ethanol is produced.
Summarise the information by selecting and reporting the main features, and make comparisons where relevant.
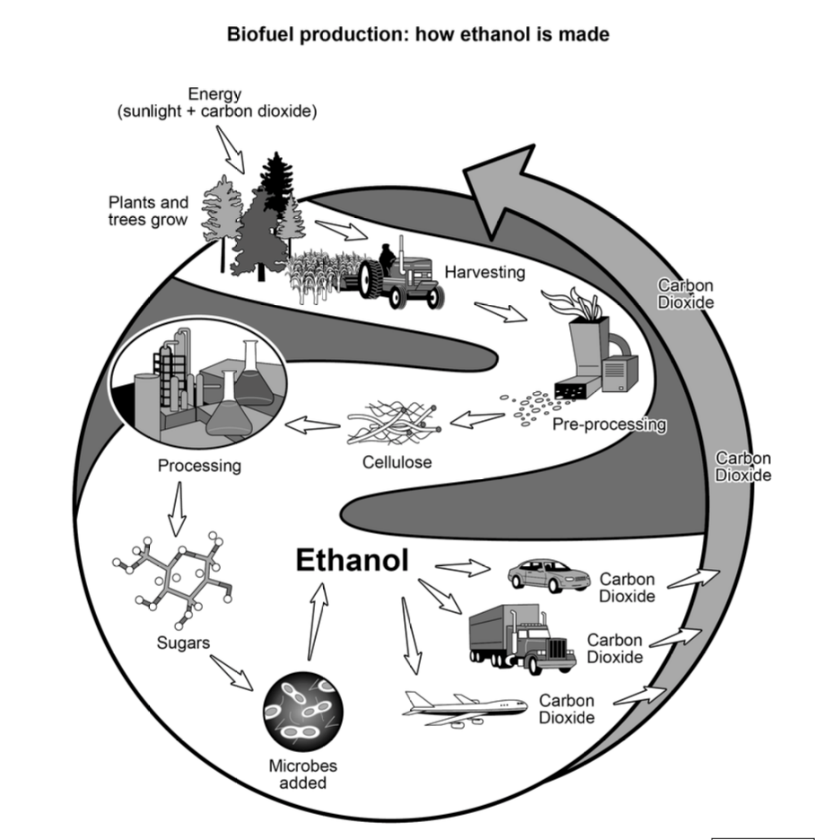
The process diagram illustrates the production of ethanol, a type of biofuel.
Overall, ethanol production is a cyclical process involving both natural and industrial stages, beginning with the growth of plants and trees and ultimately returning carbon dioxide to the natural environment.
At the initial stage, plants and trees grow by absorbing energy from carbon dioxide and sunlight through photosynthesis. Once they reach maturity, they are harvested and transported to a factory, where they undergo pre-processing and are broken down into smaller particles, from which cellulose is extracted. The cellulose is then further processed to produce sugars, to which microbes are added, which triggers certain biochemical reactions that result in the production of ethanol.
The ethanol produced is subsequently used as fuel for various forms of transport, including cars, trucks, and airplanes. When the fuel is burned, carbon dioxide is emitted into the atmosphere and is subsequently absorbed by plants again during photosynthesis. This completes the cycle, with the carbon dioxide being reused in the production of further plant material.
TASK 1 · LINE GRAPH
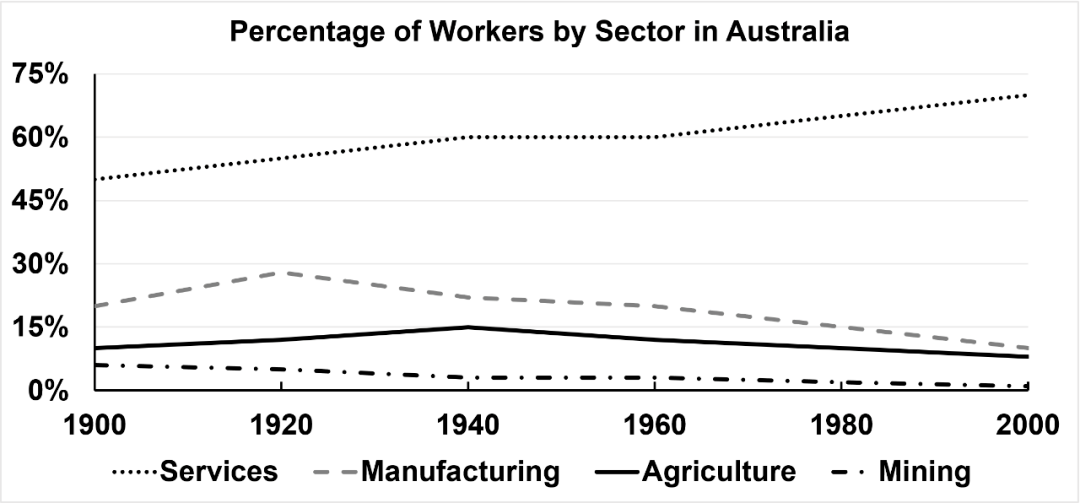
Workers by Sector in Australia
The graph below shows the proportion of workers employed by four different fields in Australia from 1900 to 2000.
Summarize the information by selecting and reporting the main features, and make comparisons where relevant.
The line graph illustrates changes in the distribution of workers in services, manufacturing, agriculture, and mining in Australia over the period from 1900 to 2000.
Overall, the service sector was consistently the predominant industry, also seeing steady growth in its proportion. By contrast, the percentages of workers in the other fields declined over the period, with that in mining being the only one that did not experience any rise.
In detail, almost half of workers were employed by the service industry at the beginning of the 20th century. The figure gradually climbed to 60% over the first four decades, before leveling off at that level for 20 years. The upward trend recovered thereafter, and about 70% of employees worked in this sector in 2000.
On the other hand, the primary and secondary sectors underwent distinct developments. Starting at 20%, the percentage of manufacturing workers grew to a peak of 30%, followed by 80 years of continuous decline, ending at just 10%. Agricultural employees experienced similar changes, although the figure was about half that for manufacturing in most years. After peaking in 1940, the percentages had dropped to a level slightly lower than the initial one by 2000. Notably, mining had always been the smallest sector, and by the end, this industry had almost disappeared.
TASK 1 · LINE GRAPH
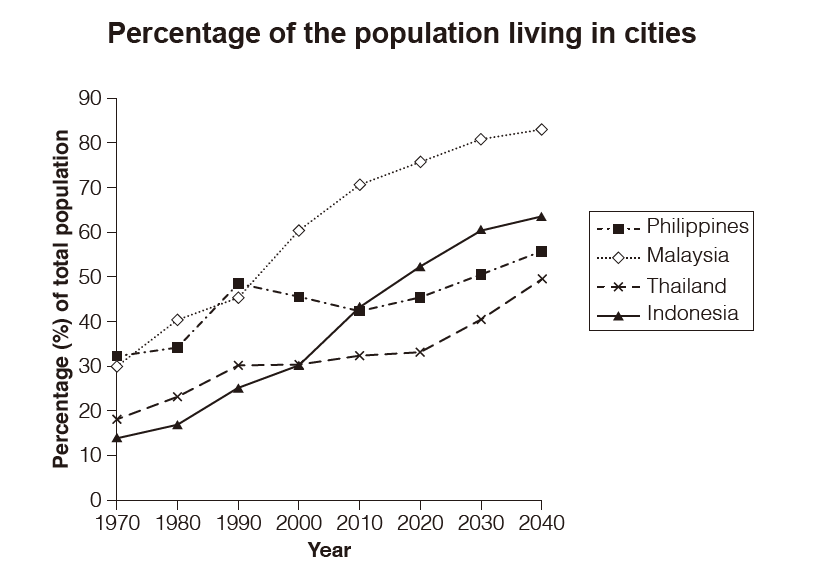
Urban Population in Asian Countries
The graph below gives information about the percentage of the population in four Asian countries living in cities from 1970 to 2020, with predictions for 2030 and 2040.
Summarize the information by selecting and reporting the main features, and make comparisons where relevant.
The line graph illustrates changes in the percentages of urban population in four countries of Asia over the period from 1970 to 2020, with projections until 2040.
Overall, urbanization rates in all four countries had risen by 2020, albeit to varying degrees, with the most significant growth recorded in Malaysia. Malaysia also had the largest proportion of urban population by that year. Notably, the Philippines was the only nation that experienced a temporary decline during the timeframe. All four nations were predicted to continue the urban growth over the following two decades.
Specifically, 30% of Malaysia's population lived in urban areas. The figure then rose sharply over the period, more than doubling by the end and ending at roughly 75%. Indonesia exhibited an almost parallel trend, with its proportion growing from less than 15% to 50%. The growth rates of both countries slowed in the latter half of the period, although further increases were projected over the following two decades. 80% of the population in Malaysia and 60% of that in Indonesia were predicted to reside in urban areas in 2040.
By contrast, while also registering growth, the trends in the Philippines and Thailand were less steady. After peaking at 50% in 1990, the urbanization rate of the Philippines showed a moderate fluctuation, finishing at approximately 45%. The figure for Thailand, on the other hand, levelled off at about 30% for the last three decades. Both proportions were projected to keep increasing. Thailand recorded the sharpest predicted growth of almost 20%.
TASK 1 · LINE GRAPH
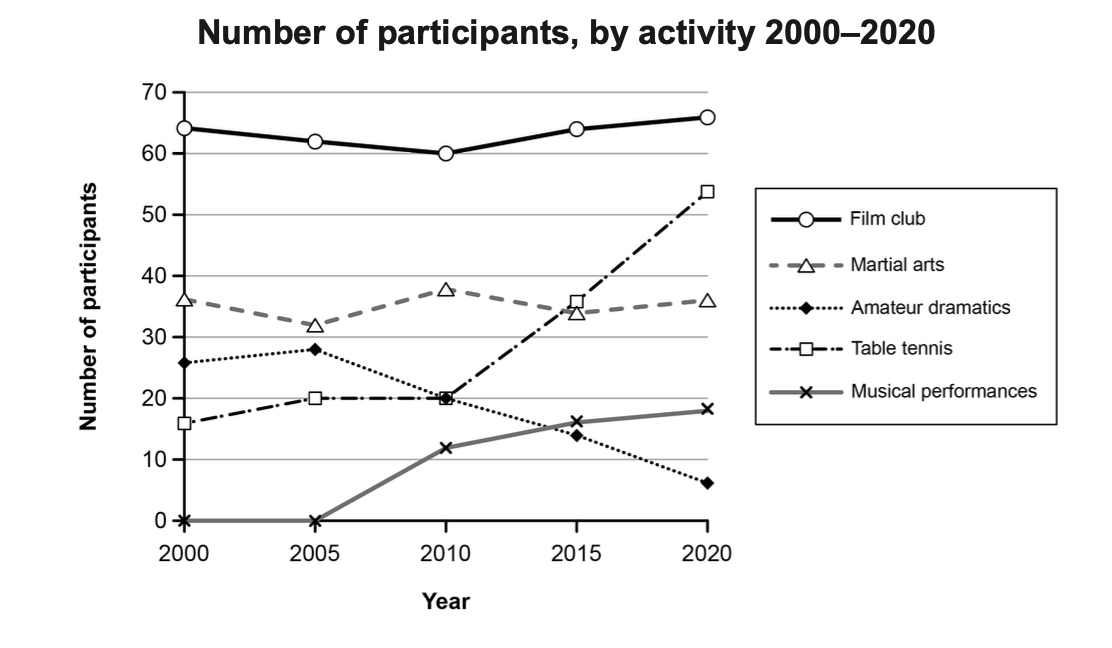
Social Centre Activities
The graph below gives information on the numbers of participants for different activities at one social centre in Melbourne, Australia for the period 2000 to 2020.
Summarize the information by selecting and reporting the main features, and make comparisons where relevant.
The line graph illustrates changes in the number of participants in five different activities at a social centre in Melbourne, Australia, over the 20-year period from 2000 to 2020.
Overall, the film club was consistently the most popular activity among the five. The participation in it and in martial arts remained broadly stable. Meanwhile, table tennis and musical performances saw an upward trend in participant numbers, while amateur dramatics was the only activity that showed a clear overall decline.
In detail, participation in the film club fluctuated slightly but remained relatively stable at around 65 over the period. Similarly, the figure for martial arts hovered around 35, despite more noticeable fluctuations.
The remaining activities displayed clearer patterns. Starting at roughly 25, the number of participants for amateur dramatics climbed to a peak of nearly 30 but then dropped markedly to below 10 during the following 15 years, becoming the smallest category by the end. In contrast, the figure for table tennis, starting at 15, surged to over 50 over the period, despite a plateau in the early stage, outnumbering amateur dramatics and martial arts around 2010 and 2015, respectively. Musical performances, having no participants until 2005, witnessed noticeable growth in its figure thereafter, registering nearly 20 in 2020, while remaining relatively low in number.
TASK 1 · TABLE
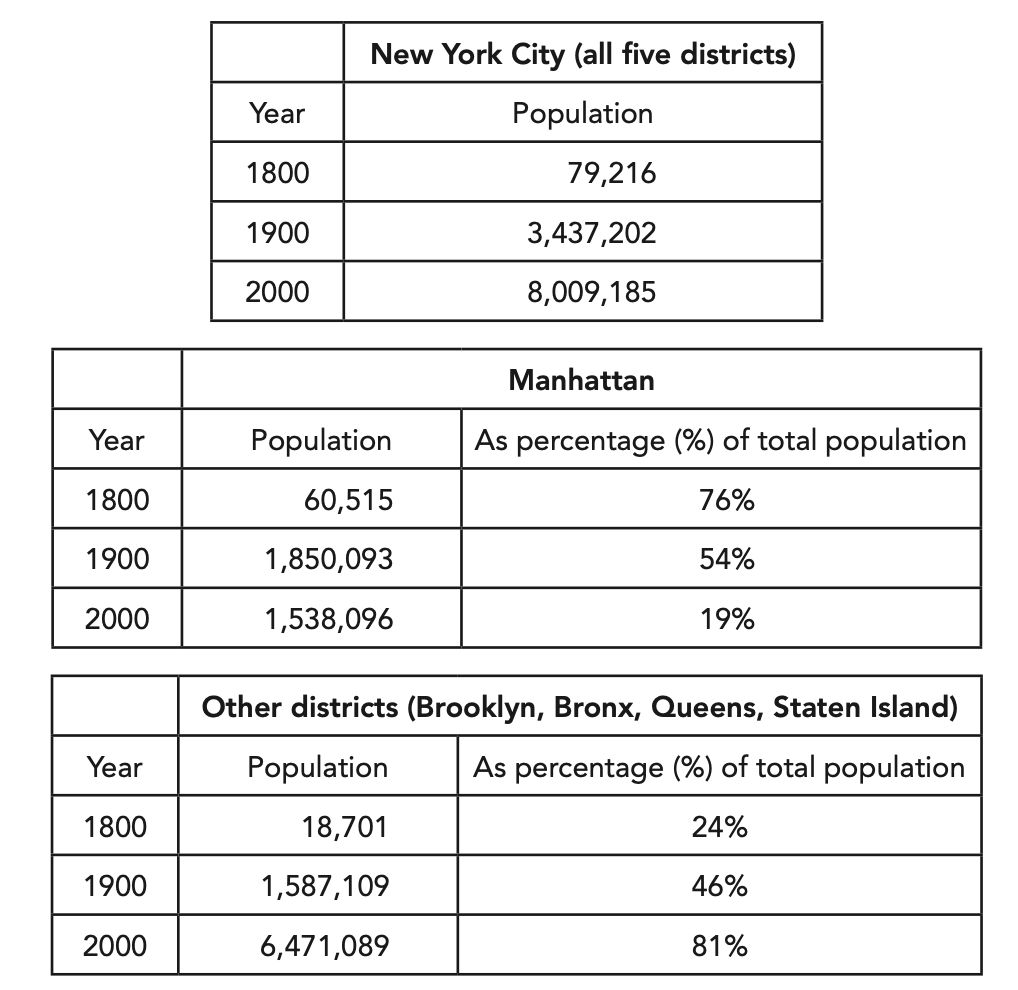
New York City Population
The first table below shows changes in the total population of New York City from 1800 to 2000. The second and third tables show changes in the population of the five districts of the city (Manhattan, Brooklyn, Bronx, Queens, Staten Island) over the same period.
Summarize the information by selecting and reporting the main features, and make comparisons where relevant.
The first table presents how the total population of New York City changed over the 200-year span from 1800 to 2000, and the second table gives information about the changes in the specific distribution of the population across the five districts of the city over the same period.
Overall, the total population of the city grew sharply across the two centuries. Noticeably, its distribution had shifted away from a Manhattan-concentrated pattern by the year 2000.
To be specific, at the beginning of the period, almost 80 thousand people resided in New York City, with the majority dwelling in Manhattan (76% of the total). Over the next century, the population grew approximately a hundredfold, registering over 8 million by the 21st century.
The surge in the total population of New York City was accompanied by migration across districts. Manhattan's population experienced a drastic increase in the first half of the period, soaring by roughly 30 times from about 60 thousand to around 1.8 million. This, however, turned out to be a peak, as the figure dropped over the following 100 years, ending at approximately 1.5 million, accounting for only 19% of the total. By contrast, while the other four districts, including Brooklyn, Bronx, Queens, and Staten Island, were home to only less than a quarter of NYC residents in the initial stage, nearly 6.5 million people lived there in 2000, representing 81% of the total population.
TASK 1 · BAR CHART
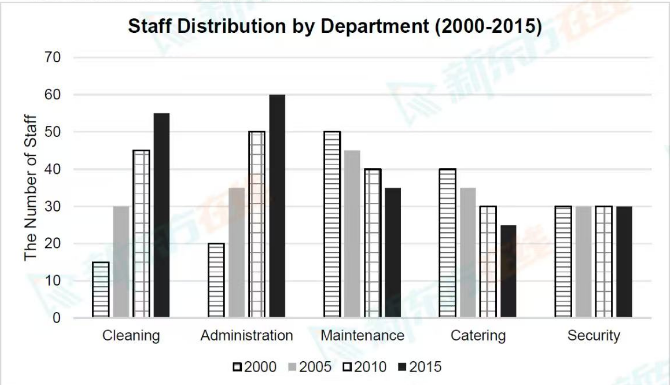
Non-medical Staff at a UK Clinic
The chart below shows the numbers of five different types of non-medical staff employed at a clinic in the UK between 2000 and 2015.
Summarize the information by selecting and reporting the main features, and make comparisons where relevant.
The bar chart illustrates changes in the numbers of staff in five different non-medical departments at a UK clinic from 2000 to 2015.
Overall, the numbers of employees in maintenance and catering decreased, while those in cleaning and administration increased over the period. The size of the security department, on the other hand, remained stable. Notably, while maintenance had the most employees initially, administration had become the largest department by the end.
In detail, 50 people were employed in maintenance in 2000, while the figure dropped gradually to 35 in 2015. Catering followed a similar trend, remaining consistently around 10 people lower than maintenance. In comparison, the number of security staff remained stable at 30.
By contrast, considerable expansion could be seen in cleaning and administration. Both figures rose steadily over the period, with administration consistently outnumbering cleaning by five people. The former tripled from 20 to 60, while the latter rose markedly from 15 to 55. Growth in both figures slowed during the final five years. By 2010, cleaning and administration had overtaken maintenance and catering to become the two main departments.
TASK 1 · DIAGRAM
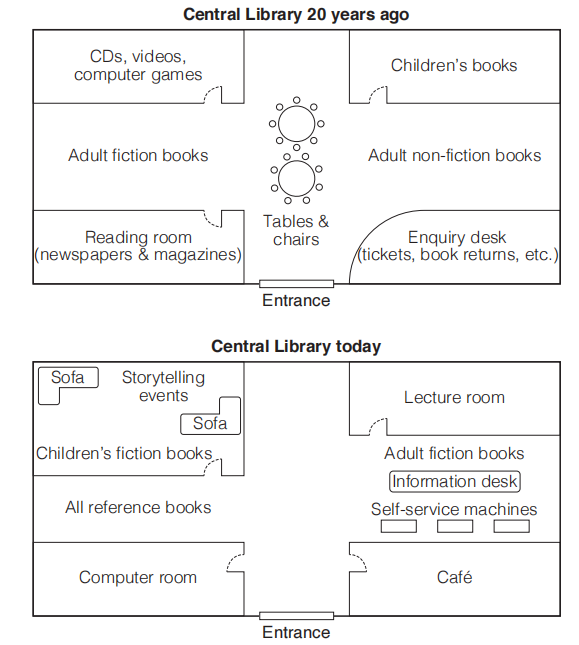
Central Library Changes
The diagram below shows the floor plan of a public library 20 years ago and how it looks now.
Summarise the information by selecting and reporting the main features, and make comparisons where relevant.
The maps illustrate the layout design of Central Library 20 years ago and its current configuration.
Overall, the library has undergone significant changes, with the reading areas reorganized and auxiliary facilities replaced by new ones, while the general layout remained largely unchanged.
Twenty years ago, to the west of the entrance in the south, there was a reading room with newspapers and magazines, which has now been turned into a computer room. To the east, an enquiry desk was situated. At present, it has been replaced by a café. In the middle of the library, adult fiction, which was positioned in the west, has been moved to the right-hand side of the space and all reference books are now on its original site. There is a smaller information desk with self-service machines in what once was the adult non-fiction section.
Further north, the northwest corner used to be for electronic resources, such as CDs, videos, and computer games. The area has become a place for children, accommodating storytelling activities and providing sofas. A lecture room has been built on the opposite side, where children's books used to be. Notably, tables and chairs previously placed in the center have been removed, making the central area now an open space.
TASK 1 · DIAGRAM

College Café Redesign
The plans below show a college café before it was redesigned and how it looks now.
Summarise the information by selecting and reporting the main features, and make comparisons where relevant.
The two plans illustrate how the layout of a college café has changed before and after it was redesigned.
Overall, the café has been expanded on the south side, with more dining facilities added. Most of the indoor facilities have been replaced, while the general L-shaped layout has remained largely the same.
The northwestern corner is the food-preparation area. The kitchen at the northern end of this section remains, while the serving area below now has a reduced function. Previously serving all food and drinks, the area is now reserved for hot meals only, with other types of products being served at different spots in the dining area. Specifically, a salad bar has been added in the west of the main area. The two sections of the former staff dining room in the middle have now been converted into a takeaway window and a coffee bar, respectively. Further east, near the entrance, additional bins have been installed, and these are now designated for recycling.
Despite these alterations, the tables and chairs and the toilets in the southeast corner have been retained. Further south, outside the main construction, a number of seats have been added for outdoor dining. Notably, a barbecue stand has also been added. To ensure easy access to this area, two entrances have been newly added on the south side of the main construction, in addition to the original ones around the building.
TASK 1 · LINE GRAPH
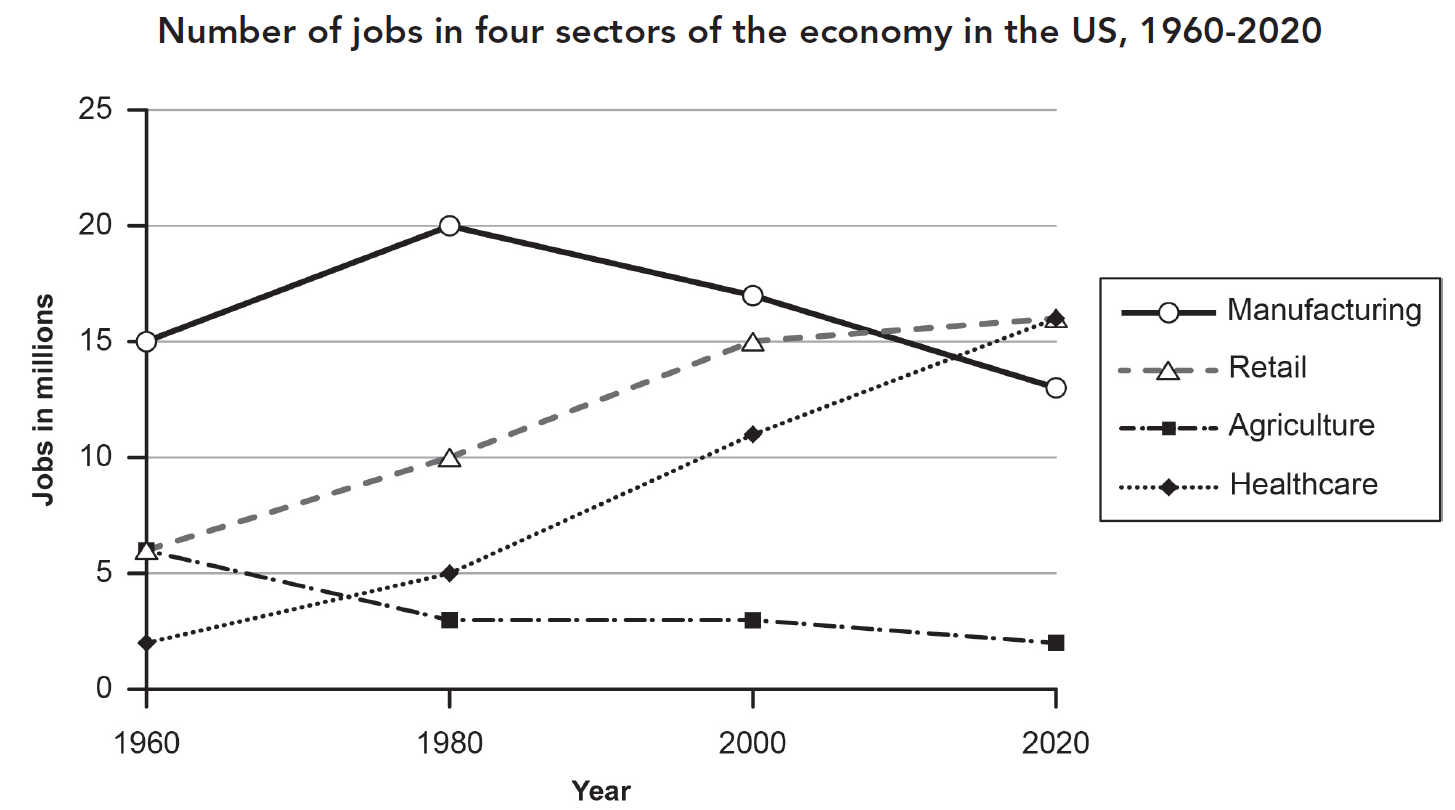
Jobs in Four US Sectors
The graph below gives information about the number of jobs in four sectors of the economy in the US between 1960 and 2020.
Summarise the information by selecting and reporting the main features, and make comparisons where relevant.
The line graph illustrates how many jobs were available in four industries in the United States over the 60-year period from 1960 to 2020.
Overall, while manufacturing offered the largest number of jobs at the beginning, retail and healthcare had become the largest sectors among the four by 2020. In addition, the numbers of jobs in the primary and secondary industries declined over the period, while those in the tertiary sector grew steadily. Notably, agriculture was the only category that did not see any growth.
Specifically, there were 15 million positions in manufacturing in 1960. The figure climbed to a peak of 20 million over the following two decades before declining continuously towards the end of the period, finishing at roughly 13 million. Agriculture showed a more consistent trend, with the number of jobs in this field falling from over 5 million to approximately 2 million.
By contrast, both retail and healthcare experienced noticeable employment growth. While retail started at the same level as agriculture and healthcare provided far fewer jobs initially, both grew considerably over the period and ended joint highest, at over 15 million. The number of jobs in both sectors overtook that of manufacturing in the 21st century, while healthcare surpassed agriculture in the 1970s.
TASK 1 · DIAGRAM
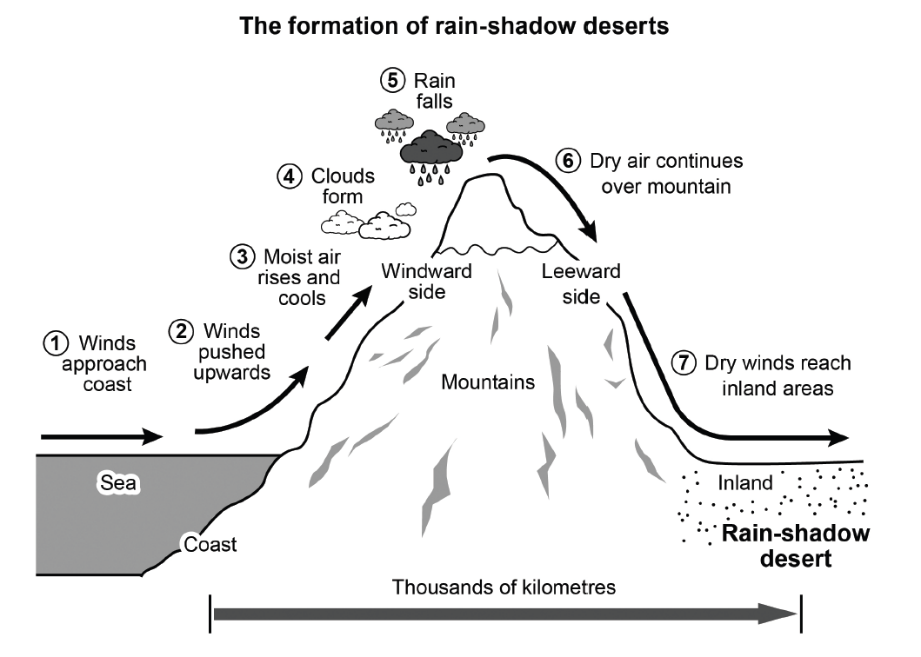
Rain-Shadow Desert Formation
The diagram below shows how one type of desert, known as a rain-shadow desert, is formed.
Summarise the information by selecting and reporting the main features, and make comparisons where relevant.
The process diagram illustrates how a rain-shadow desert is formed.
Overall, the formation of such deserts is a linear natural process in which moist air rises over a mountain, loses its moisture as precipitation, and eventually becomes dry air, creating arid conditions inland.
At the initial stage, winds travel across the ocean, increasing the humidity of the air. As they approach the side of the mountain facing the sea, known as the windward side, the moist air is pushed upwards. As it rises along the slope, its temperature falls, causing water vapour to condense and form clouds. While the air continues to rise, water droplets combine and become increasingly large. When they become too heavy to remain suspended in the clouds, they fall to the ground as rain.
After losing most of its moisture through precipitation, the air continues over the mountain towards the leeward side. As it descends, its temperature rises, causing the air to become increasingly dry. Finally, these dry winds travel inland, where they create the arid conditions that form a rain-shadow desert. The entire process takes place over a distance of thousands of kilometres.